Operational statuses of individual elements are updated based on monitoring system information retrieved by Nextian RMM. Individual element statuses then roll up to service statuses.
The following operational status values are available for elements:
- Up — The element is fully operational.
- Has Issues — Element is available but experiencing issues (e.g., long response times).
- Down — Element is not available.
- No Data — No data has been collected for the element yet.
- Unmanaged — The element is unmanaged (the Managed flag is not set), and therefore does not have an operational status assigned.
Operational Status History
In addition to current status, Nextian maintains a 30-day operational status timeline for each element. This timeline is designed to balance data retention with Salesforce storage constraints, and reflects the fact that account managers typically do not require long-term historical detail, unlike NOC (Network Operations Center) personnel.
For longer-term analysis, aggregated availability statistics (e.g., “99.9% uptime over the last 24 months”) are calculated separately. The 30-day limit applies only to detailed status records.
Examining Element Operational Status History
To examine element’s operational status history in Salesforce:
- Open element details.
- Scroll down to the Availability Timeline section.
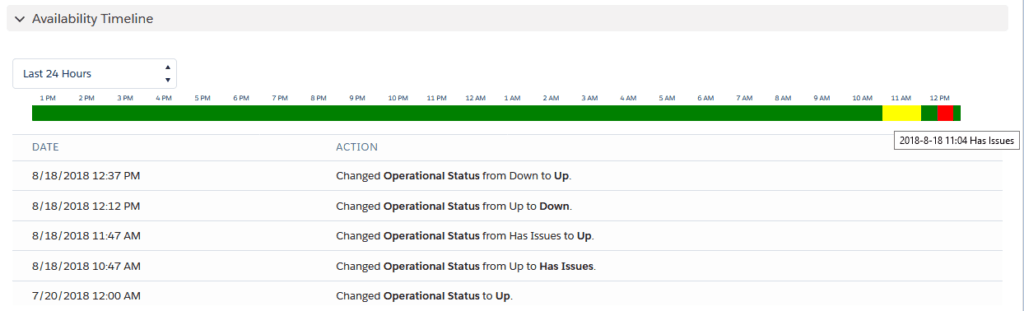
Using the Availability Timeline component:
- Adjust the time filter to change the displayed time range.
- The lower section displays status change records, including timestamps recorded by the monitoring system. Hover over the timestamp to view a tooltip with the exact time (including seconds).
- Double-click any entry to view its full details.

