Nextian brings select key performance metrics for both services and elements from monitoring systems to Salesforce.
These metrics are simplified designed to:
- Be easily understood by CRM users (e.g., account managers, sales representatives).
- Enable meaningful, data-driven conversations with customers, while minimizing Salesforce storage usage (Salesforce storage can incur additional costs).
- Detailed, real-time data remains available in the source monitoring system for technical users.
| Important | All performance metrics calculations (e.g. averages, minimums, maximums) are performed entirely by the Nextian RMM. Salesforce is responsible only for presenting the data. |
Data Model
Performance metrics for both services and elements are stored in the Performance_Metric__c custom Salesforce object. The following fields are tracked:
| Field | Description |
|---|---|
| Name | Metric name, e.g., ‘Average Response Time (ms)’. It is possible to have multiple performance metrics with the same name; in that case it means that they pertain to the same counter and only have different aggregation levels. |
| Element | Element associated with the metric (set for metrics associated with elements rather than services). |
| Service | Service associated with the metric (set for metrics associated with services rather than elements). |
| Period | Period for which a metric is provided, e.g., ‘Last 24 Hours’, ‘Last Month’, etc. |
| Unit | Measurement unit for the metric: integer, decimal, percentage, etc. |
| Avg. Value | Average value of all samples over the measurement period. |
| Max. Value | Maximum value sampled over the measurement period. |
| Min. Value | Maximum value sampled over the measurement period. |
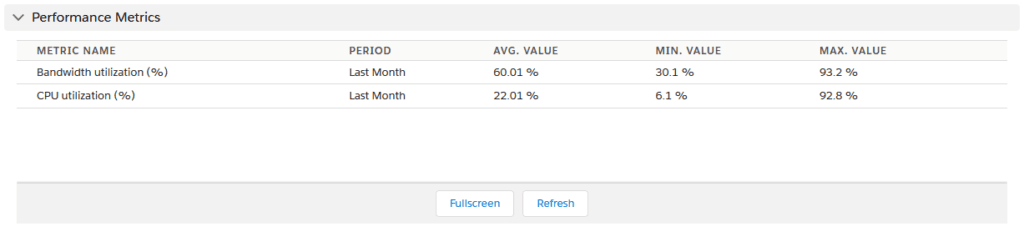
Accessing Service Performance Metrics
To examine service performance metrics in Salesforce:
- Open service details.
- Scroll down to the Performance Metrics section.
Click here to learn how to examine element performance metrics.

