Automated Upsell Opportunity Detection for Cloud and Communication Services with Nextian
Cloud and communications subscription services — such as Internet access, servers, hosted applications, or storage — often have a lifespan measured in years.
Once a sales representative closes a sale and service is up and running, account managers usually have limited visibility into service performance, as well as potential upsell and cross sell opportunities.
This lack of visibility may lead to:
- Missed revenues: While there may be chances for upselling, account managers are unaware of potential upsell opportunities. Meanwhile, customers may even exploring other options because “the product is not working well”.
- Poor customer experience: Issues are often addressed reactively rather than proactively (i.e., “with this increase of storage use, you’re likely to run out of it in 2-6 month”). Even if the problem isn’t directly the provider’s fault, it can still negatively impact the customer experience.
Providers often attempt to solve this issue by assigning their engineering support teams to provide account managers with relevant information, such as bandwidth utilization reports for Internet Service Providers. However, this approach is usually ineffective, as support teams are already occupied with their primary responsibilities and view these requests as a distraction from their core duties.
Nextian solves the problem in a systematic, “zero-touch” way without creating additional overhead for support teams.
Monitoring Systems Overview
Monitoring systems are traditionally referred to as NMS (Network Monitoring Systems) for networks, and APM (Application Performance Monitoring) for software applications. RMM (Remote Monitoring and Management) is a term often used interchangeably with NMS.
Observability is a more recent term that refers to advanced monitoring and analytics of software performance, particularly in the context of DevOps practices.
A typical monitoring system involves a database containing nodes or elements that are monitored. Elements typically represent network devices, applications, network cards, etc.
Passive monitoring involves the system listening for events from elements, such as SNMP traps or event logs. In contrast, Active Monitoring involves actively querying and element for metrics.
Monitoring systems often allow multiple sensors to be configured for each node, with different polling intervals and metrics collected.
These systems provide a detailed view of individual elements, enabling instant problem identification (e.g., outages, CPU overloads, high network usage, excessive SQL queries) and real-time alerts.
Business Perspective vs. Monitoring Perspective
The challenge lies in the differing perspectives between business and monitoring systems. When an element goes down, business people typically want to know:
- Which customers are affected?
- How much do these customers spend with us?
- Which services are impacted?
- How much revenue is potentially at risk?
Business questions also apply to performance metrics:
- What level of average CPU usage justifies a discussion about an upgrade?
- At what point does bandwidth utilization begin to affect the applications that depend on it?
Adding to the complexity, analyzing customer needs requires a broader perspective: one must understand what the service (product) is, which elements make up the service and the impacts of their performance metrics on the overall service quality and user experience.
Addressing these business-centric questions cannot be achieved solely through NMS or APM systems — this is where Nextian provides a solution.
Detecting an Upgrade Opportunity
To identify an upgrade opportunity, requires looking at both business and performance information:
- Product Details. What the customer has purchased (e.g., a large VM, a colocation with 100mbps Internet, a cloud database)?
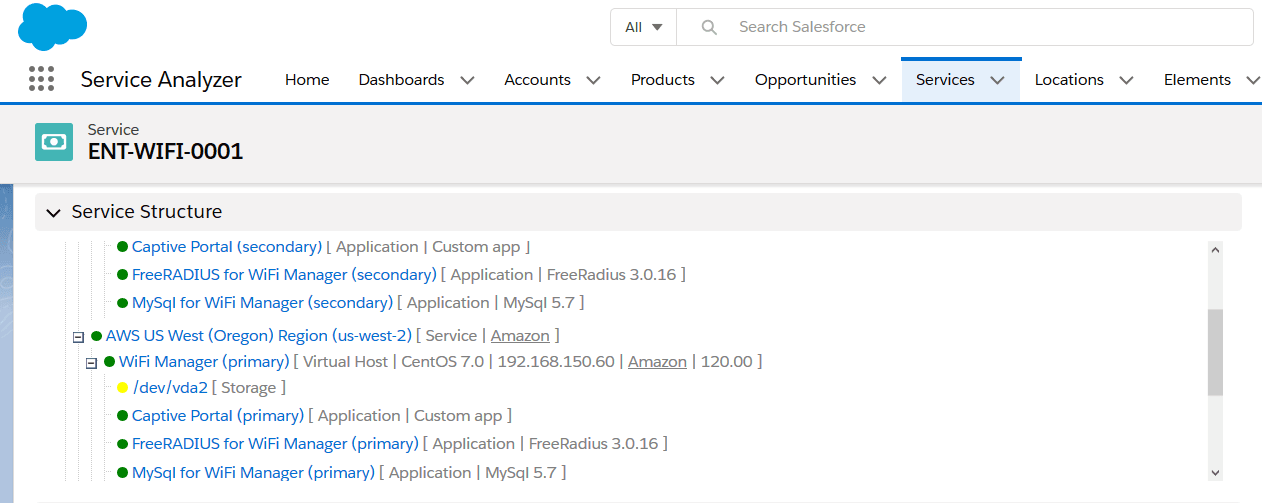
- Product Composition. How is the product built? What does it consist of (a router, a VM, storage, database, UC infrastructure, etc.)? This includes monitored elements as well as their dependencies.
- Element Performance Information. Performance information for each element, e.g., CPU loads, response times, NetFlow traffic information, storage usage, numbers of calls made, SQL queries, bandwidth utilization, etc.
Nextian’s upgrade analytics approach begins with a service-oriented perspective and then looks at element performance. This approach contrasts with the traditional NMS/APM logic, which focuses primarily on individual elements.

How Does It work?
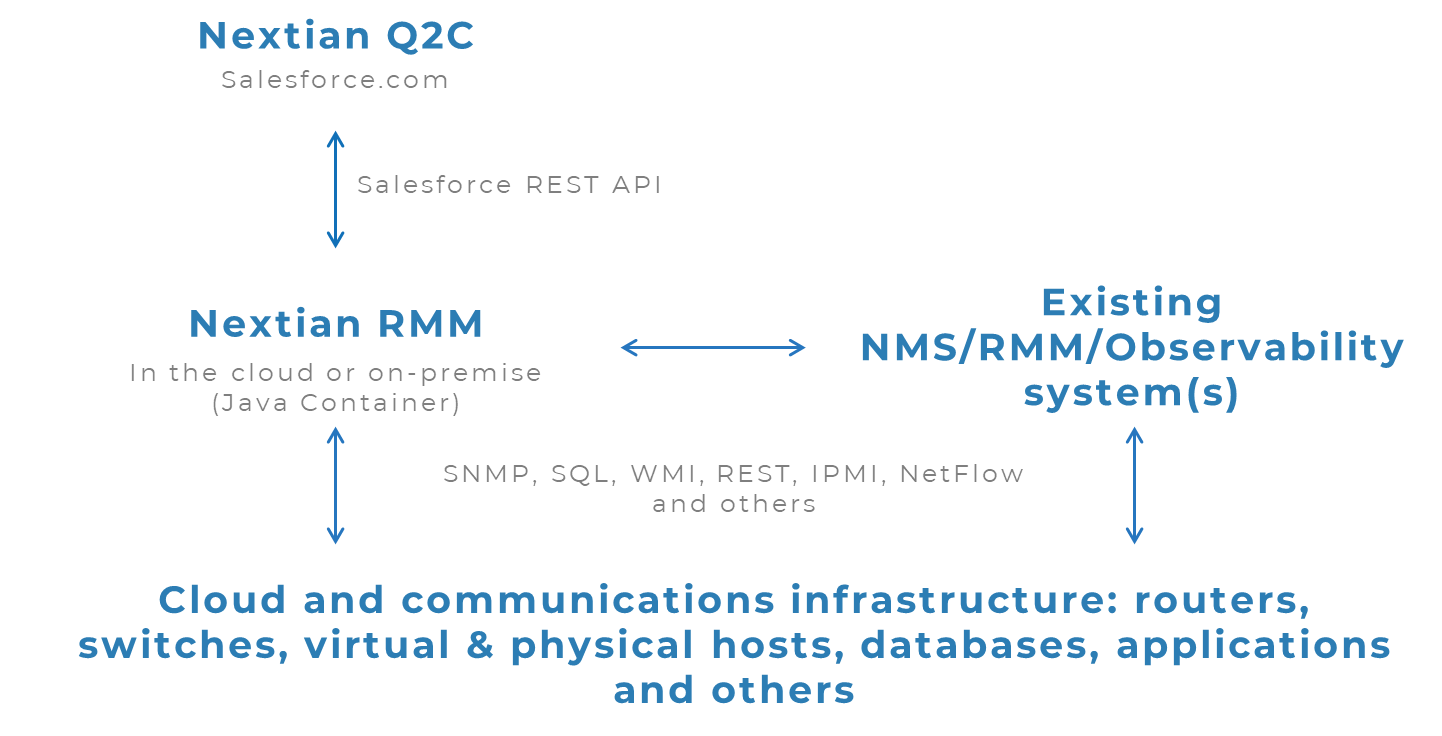
Nextian Monitoring Integration consists of two key components:
- Nextian Salesforce Package adding element objects, performance metrics, alarms, upgrade opportunities and others to Salesforce orgs.
- Nextian RMM running outside Salesforce (either in the cloud or on-premise), collecting monitoring data either directly or by integrating with existing NMS, RMM, APM, or observability systems, transforming data and pushing it to Salesforce.
The following diagram illustrates the interactions between these components and information flow:

The processing logic can be summarized as follows:
- Collect usage data from applications, hosts, networks and other infrastructure.
- Run data through the analytics engine.
- Compare against product information.
- Update metrics in Salesforce.
- Create actionable alarms and upgrade opportunities.
- Push information to the Salesforce CRM so it is immediately visible to account managers.
Select Use Cases
| Problem | Detection Method | Action |
|---|---|---|
| Bandwidth upgrade | ||
| Identify high bandwidth usage that qualifies for an upgrade. | Compare actual usage (both regular and burst) with the bandwidth originally sold. | Create an upgrade opportunity in the CRM to offer a higher bandwidth product, or burstable bandwidth add-on. |
| Bandwidth Upgrade with Traffic Analysis | ||
| Detect bandwidth usage that impacts application performance, such as voice services (e.g., SIP, Teams) experiencing quality issues due to bursts of high-volume data transfers. | Analyze usage statistics, traffic types and available bandwidth. | Generate an upgrade opportunity in the CRM to offer options like higher bandwidth, a Quality of Service (QoS) add-on, or a dedicated voice link. |
| Future bandwidth saturation | ||
| Identify upcoming bandwidth saturation before it degrades customer service. | Apply predictive analytics to forecast future usage trends. | Generate a future upgrade opportunity for the service and assign it to the account manager. |
| Abnormal bandwidth utilization | ||
| Detect abnormal bandwidth utilization, such as unusually high usage that may indicate fraud or unusually low usage that could signal a technical issue. | Establish usage baselines for different weekdays and times, and analyze current utilization against these baselines. | Generate an alert and assign it to the appropriate team: the account manager or fraud team for high utilization, or support for low utilization. |
| Abnormal Data Transfer Volumes | ||
| Detect anomalies in the volume of data transferred rather than just bandwidth usage. Fraudulent activities, such as BitTorrent downloads, may use throttled bandwidth and evade detection if only bandwidth is monitored. | Establish baselines for normal data transfer volumes and compare actual transfer data against these baselines. | Generate an alert and assign it to the account manager or fraud team for further investigation. |
| Dedicated cloud connection needed | ||
| Identify significant traffic to major cloud providers (e.g., AWS, Azure, Salesforce) and consider offering a dedicated cloud connection. | Analyze WAN traffic to major provider data centers using NetFlow data. | Create an upgrade opportunity in the CRM and assign it to the account manager. |
| Virtual server storage | ||
| Detect when a customer is approaching their server storage limit to proactively propose an expansion. | Identify when projected usage is likely to exceed a critical threshold (e.g., 90%) based on historical trends. | Generate an upgrade opportunity and assign it to the account manager to follow-up on. |
| Abnormal Wi-Fi Usage | ||
| Identify unusually high numbers of users on managed Wi-Fi network, which could indicate fraud or a technical issue. | Monitor access point clients and RADIUS sessions, and compare them against typical usage patterns. | Generate an alert and assign it to the account manager or fraud team for further investigation. |
Selecting Monitoring Sources
Nextian RMM can gather performance and availability data either through direct monitoring or by integrating with other NMS/APM systems.
We recommend using data from existing NMS/APM systems to maintain consistency. Different monitoring systems can produce slightly varying results (such as response times, alarm durations, and availability) due to differences in probing times and intervals. Additionally, having two NMS systems actively monitor the same elements is not ideal.
Nextian RMM can also concurrently source and aggregate data from multiple RMM/NMS/APM systems that may be responsible for different parts of the infrastructure (e.g., network, servers, databases, applications, etc.).
Conclusions
Automated discovery of upgrade opportunities boosts revenue and enhances customer experience by effectively connecting sales and account management with service monitoring.
Integrating monitoring systems and analytics with Salesforce enables account managers and sales teams to increase revenue without adding extra workload to support teams.
Nextian Network Monitoring Integration is an out-of-the-box solution integrating the majority of popular NMS/RMM/Observability systems (SolarWinds, Zabbix, OpenNMS and others) with Salesforce.
Contact us today to find out how we can help you!


