Measuring Efficiency Gains of Quote-to-Cash (QtC) Projects
Many businesses pursue Quote-to-Cash (QtC or Q2C) initiatives to streamline and improve operations, but they often face challenges measuring efficiency gains of Quote-to-Cash projects.
This post dives into how to establish goals and measure success of Quote-to-Cash (QtC) projects, as well as high-level strategies for what to look for.
What is Quote-to-Cash?
Quote-to-Cash is an IT-driven strategy for integrating and automating end-to-end business processes. It spans the entire product lifecycle — from planning, quoting, and delivery to billing, payments, and financial analysis.
Organizations undertake various IT projects such as CPQ deployments, CRM customizations, systems integration, process automation and others to enhance the efficiency of their QtC.
QtC is an excellent planning and implementation framework for business transformation & optimization from both IT and non-IT perspectives. It has a proven track record of finding performance bottlenecks, defining business architectures and project prioritization (see this blog post on establishing QtC priorities).
However, businesses frequently focus on the implementation phase of QtC while inadequately or incorrectly defining the success criteria (e.g., “increase efficiency,” “reduce cost”). This can result in projects falling short of expectations or prioritizing the wrong initiatives altogether.
Defining Quote-to-Cash Goals
The list below provides a few examples of real-world Quote-to-Cash transformation goals:
- 10% reduction in order delivery costs.
- Lower SG&A per $ of generated revenue.
- Process 10% more orders without increasing headcount.
- Reduce order delivery time by 25%.
- Minimize errors to lower correction costs and enhance user experience.
- Accelerate sales velocity by shortening the sales cycle.
- Improve data quality for accurate reporting.
- Increase operational efficiency.
It is easy to notice that some of the above goals are better than others.
A strong set of Quote-to-Cash goals should:
|
Refining Goals
While the “what” is business-driven (e.g., “reduce transaction costs by 20%”), the “how” involves processes and IT systems.
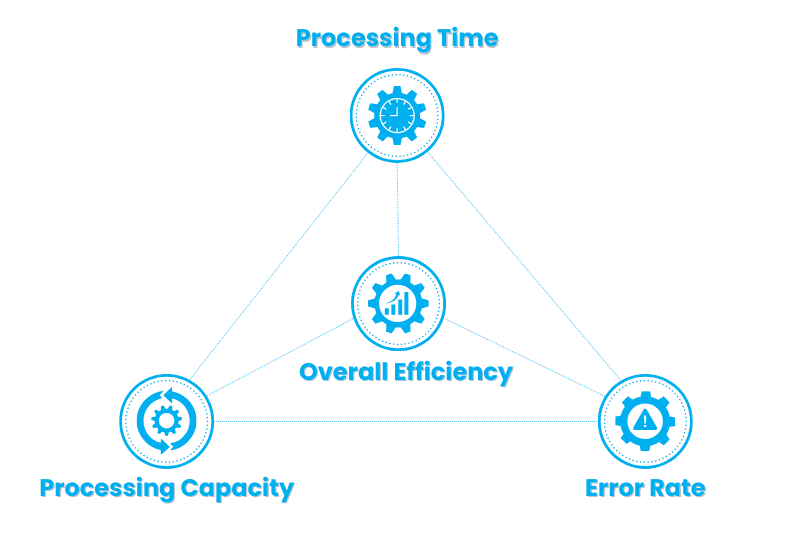
As far as IT systems are concerned, QtC optimizations generally fall into three categories:
Regardless of the specific metric taken — e.g., relating to quotes, orders, or MTTR — these categories shape goals and gains. |
Very often, one of these is a countermeasure to the other two: speed can be increased and the expense of efficiency and accuracy; accuracy will suffer with increased speed while keeping the same efficiency levels, etc. Exceptions are usually related to automation which can improve all three at the same time.

The following sections discuss each category in detail.
Increased Processing Capacity
Capacity is best measured through unit economics, reflecting revenue or cost efficiency per unit.
Examples (“What”):
- Operational cost per $ of new revenue.
- Number of quotes generated per sales team member.
- New order revenue $ delivered per operations department headcount.
Means of Improvement (“How”):
- Integration across systems in process flows (e.g., sales to delivery).
- Automating manual processes (e.g., eliminating manual entry).
- Optimizing parts of the process: faster quoting with CPQ, implementation of uniform process flows for order delivery, etc.
- Introducing task-driven delivery workflows with automated hand-offs, task queues, workload balancing, skills-based assignments, etc.
Decreased Processing Time
Processing time is based on average interval measurements both end-to-end (e.g., quote to bill) as well as across specific segments (e.g., order to order confirmation). Interval variability (divergence from average values) is also an important (and often overlooked) measure, as it gives insight into process consistency and repeatability.
Examples (“What”):
- Sales: Time to close a qualified opportunity, quote to bill, lead-to-quote.
- Order processing: Order placed to delivery; order received to order confirmation.
- Customer support: Mean Time to Repair (MTTR).
Means of Improvement (“How”):
- Shortening critical path in the delivery process.
- Replacing data swivel-chairing with integrations.
- Streamlining information flow in the organization (e.g., with tasks, queues, cases, etc.).
- Making information more accessible (reduce staff time spent searching for information).
Reduced Error Rate
The error rate is best measured per unit of revenue or unit of processing (i.e., transaction count). Weighted values can be applied, as some errors are easier to correct (i.e., have a lower correction cost) or have a lower customer impact.
Examples (“What”):
- Number of orders with issues/jeopardies.
- Incorrect data entry count.
- Service desk cases per product.
Means of Improvement (“How”):
- Minimize manual data re-entry by automating prior data reuse.
- Replace data swivel-chairing between systems with automated integrations (e.g., quote to order, order to billing).
- Automate processing with workflows to ensure sequence of steps, required data entry, etc.
- Employ data validation rules.
- Run data quality checks & reports; continuously improve data quality.
Conclusions
Quote-to-Cash (QtC) is a highly effective framework for driving business transformation and optimization from both IT and non-IT perspectives. With a proven track record of success, QtC can bring significant operational improvements. However, one of the most common challenges businesses face, lies in measuring efficiency gains of Quote-to-Cash (QtC) projects.
Goal-setting is a critical step in the QtC optimization process. Well-defined goals should be:
- Specific and measurable,
- Define what needs to be accomplished and how,
- Have impact on at least one of the following: increasing processing capacity (efficiency), decreasing transaction time (speed) or reducing error rate (accuracy).
A strong set of goals not only guides the transformation process but also facilitates seamless ROI (Return on Investment) calculations, making it easier to track and demonstrate the value of QtC initiatives.
Nextian has extensive experience in helping businesses optimize their Quote-to-Cash processes from both business and IT perspectives.
Contact us today to find out how we can help you!


