Measuring Customer Satisfaction: Essential Metrics and Implementation Tips
In today’s competitive landscape, businesses prioritize optimizing the customer experience (CX) to minimize churn and boost customer lifetime value (CLV or LTV). Measuring customer satisfaction is a critical element of CX strategies, as it:
- Identifies areas for improvement as well as individual touchpoints.
- Helps improve specific customer interactions.
- Enables benchmarking against competition.
- Drives business growth and valuation.
This post explores essential customer satisfaction metrics and offers practical pointers for implementation, with a special focus on cloud and communications providers.
Transactional vs. Non-transactional Satisfaction Measures
Transactional customer satisfaction measures are collected after a specific transaction or “event,” such as the closure of a support case, a purchase, a support phone call, or the delivery of an order. These measures are directly tied to the transaction and must be gathered within a narrow, well-defined timeframe (e.g., 2–5 days after the event). Examples include questions like “Rate your experience” or “How was your purchase?”
Non-transactional satisfaction measures, on the other hand, evaluate the overall customer sentiment and perception of the organization, independent of any specific interaction or event. Non-transactional measures are usually collected periodically (e.g., once a quarter) and include general questions like “Would you recommend us to a friend?”.
Customer Satisfaction Score (CSAT)
CSAT is typically measured on a scale of 1 to 5, with 4 (“satisfied”) and 5 (“very satisfied”) considered as “positive” responses. These scores are often visualized as stars. The actual CSAT score is calculated using the following formula:
CSAT = (Number of Positive Responses / Total Number of Responses) x 100
One of the key challenges with CSAT is its relatively low response rate, which is often skewed toward extreme outcomes — customers tend to respond to surveys only when they are either extremely pleased or extremely displeased.
A common interpretation of CSAT results is that a score of 70% is considered good. CSAT can also be used for benchmarking against competitors. For example, the American Customer Satisfaction Index (ACSI) tracks CSAT scores for specific industries, reporting an average score of approximately 74% across all industries, with telecommunications averaging 65%.
CSAT measurements are usually implemented as:
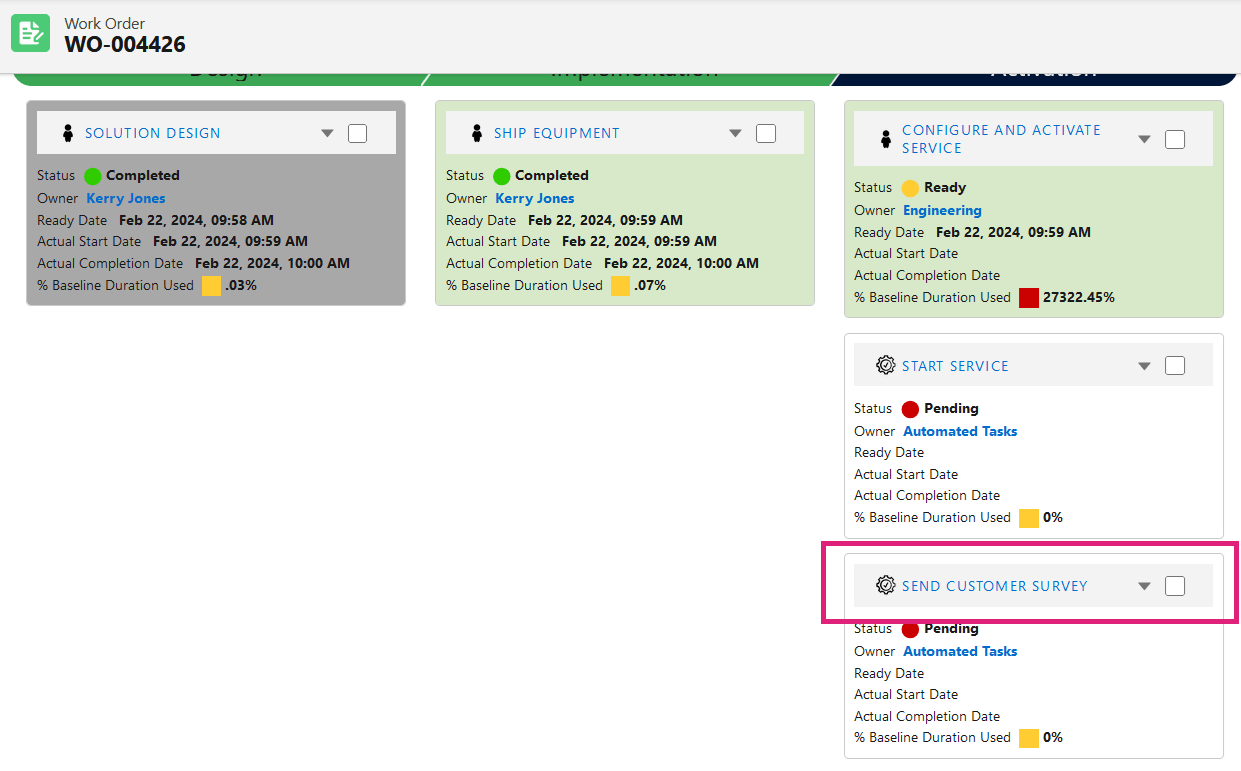
- Post-Event Email Surveys. These are triggered at the conclusion of a specific user interaction, such as completing an order. For example, the last step in the order processing workflow may be triggering a survey email.
- User Interface (UI) Actions. In that case feedback prompts are directly integrated with portals and mobile apps where users take action. For example, after resolving a support ticket, users may encounter a prompt asking, “How did we do?” to rate their experience.

Net Promoter Score (NPS)
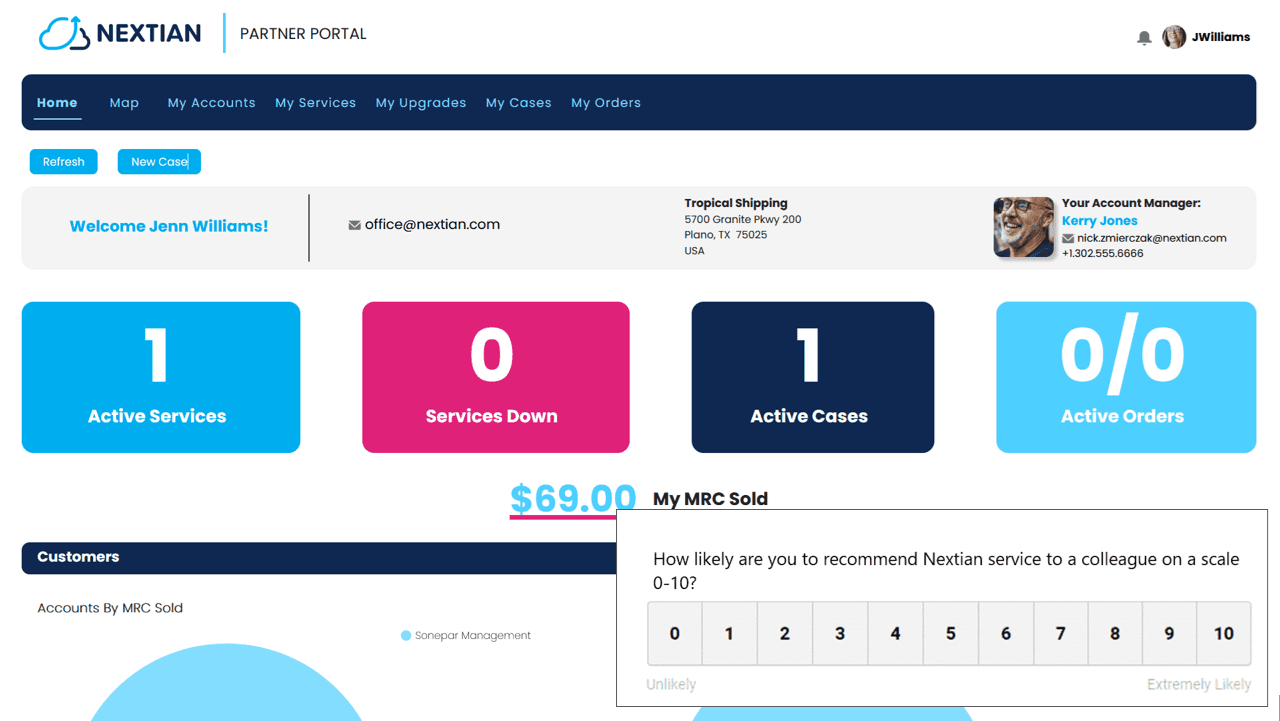
While CSAT measures customer “satisfaction,” NPS measures overall “recommendation.” It is a non-transactional measure, typically implemented through a survey or pop-up asking, “How likely are you to recommend our product to a friend or colleague?” Responses are scored on a scale from 0 (“Not likely at all”) to 10 (“Highly likely”).
NPS requires analyzing responses using the following formula to calculate the score:
NPS = % of Promoters - % of Detractors
Where “Promoters” are responders selecting 9-10 as the answer, “Detractors” select 0-6 and “Passives” select 7-8 (“Passives”). Passives are ignored in the calculation except for their contribution to the total response count.
Since the formula is not a simple average, recalculation is necessary for specific customer groups (e.g., by geography), products, or time periods to ensure accurate results.
NPS is standardized and serves as an excellent benchmark for comparing performance against competitors. Industry-specific NPS benchmarks are often published by research organizations. For example, CustomerGauge reports an average NPS of 31 for the telecommunications industry.

Transactional NPS (tNPS)
Transactional NPS (tNPS) is a variation of the traditional NPS. It is calculated in the same way as the original NPS score (% Promoters – % Detractors). The key difference is that tNPS is surveyed immediately after a specific transaction (similar to CSAT) rather than at random intervals.
The two main reasons for using tNPS alongside or instead of traditional NPS are:
- tNPS captures customer sentiment right after a specific event when user experience is “fresh”.
- tNPS provides data that can be segmented by event type, product, team and others (because the type of surveyed transaction is known).
Customer Effort Score (CES)
The Customer Effort Score (CES) is designed to measure the level of effort a customer expends on various activities related to a product or service, such as resolving an issue or installing a product.
The principle behind CES is that the level of effort is inversely proportional to overall satisfaction with the product: the higher the effort, the lower the satisfaction. This, in turn, affects customer loyalty and attrition.
CES is a transactional measure associated with specific activities. High CES scores indicate that a product is easy to interact with from the customer’s perspective, which can reduce customer service costs and product returns.
Although CES is a valuable customer satisfaction measure, it is less popular than Net Promoter Score (NPS) or Customer Satisfaction Score (CSAT) and is not universally standardized. Typically, CES is measured on a scale of 1 to 7, with 1 indicating “Extremely Difficult” and 7 indicating “Extremely Easy.” Scores of 5 and above (“Easy,” “Very Easy,” and “Extremely Easy”) are generally considered positive.
Customer Sentiment Score
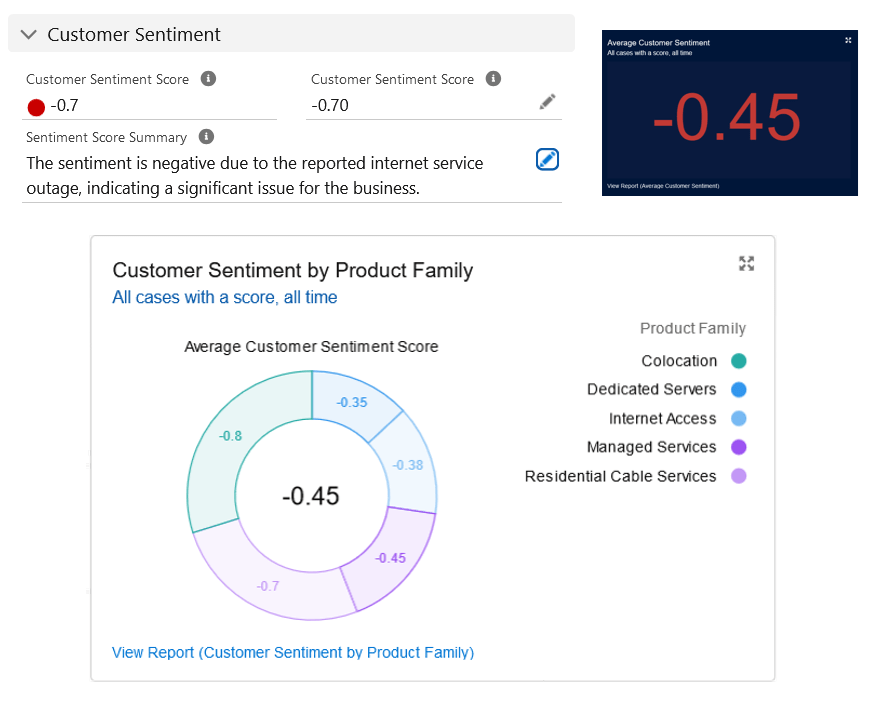
The Customer Sentiment Score leverages AI (Artificial Intelligence), specifically NLP (Natural Language Processing), to evaluate customer sentiment based on the language used in customer interactions. The resulting score ranges from -1 (Negative) to 1 (Positive), with zero representing a neutral sentiment.
A key advantage of the sentiment score is that it requires no direct action from customers, such as responding to a survey or an NPS score prompt. Instead, the input for sentiment analysis is often readily available, such as customer-submitted case subject and description, follow-up comments, and other forms of communication.
Sentiment scores can be updated “as you go” and used to influence actions before transactions are closed. For example, open cases with negative sentiment can be prioritized for additional attention, potentially improving customer satisfaction and shifting sentiment into positive territory.
For instance, Nextian calculates sentiment on orders and cases based on the language of customer exchanges. These scores can then be reported at various levels, including product, account, or contact.

However, obtaining accurate customer sentiment scores presents two main challenges:
- Sentiment analysis requires integration with OpenAI or other NLP engine.
- Ensuring score accuracy often requires consolidating information from multiple communication channels (e.g., email, chat) to account for all interactions.
Conclusions
Measuring customer satisfaction is fundamental to developing an effective customer experience (CX) strategy, fostering customer loyalty, driving business growth, and benchmarking against competitors.
For cloud and communications providers, adopting key metrics and best practices and integrating them with service delivery, support and IT systems as well as reporting tools requires careful planning and consideration.
Nextian has a proven track record of implementing satisfaction metrics ranging from basic CSAT surveys to analyzing customer sentiment using AI.
Contact us today to find out how we can help you!


