Establishing and implementing service metrics and KPIs for cloud and communication service providers can be challenging. These difficulties often stem from determining what to measure, how to calculate it, and managing the retrieval and consolidation of source data.
Key challenges typically include handling subscription changes (e.g., re-rates, replacements) and navigating the complexities of multiple systems, such as CRM, order management, and billing platforms.
Quote-to-Cash (QTC or Q2C) implementations present an excellent opportunity to enhance business reporting. Beyond the technical implementation, they allow for a comprehensive review of which KPIs and metrics should be tracked and how they should be calculated for optimal insight.
This post examines a subset of best-practice metrics implemented by Nextian Reporting & Analytics, with a particular focus on those related to Monthly Recurring Revenue (MRR).
Challenges
The key challenges are variations in formulas (there are no “standard” formulas) and terminology, as multiple terms are used (often even within a single organization), for example:
Revenue Contraction = Revenue Compression = Revenue Down-Tick
What to Report?
Recurring revenue is by far the most important metric for service providers.
Since most services are invoiced monthly, Monthly Recurring Revenue (MRR) is particularly important.
While this post focuses on revenue reporting, it is relatively easy apply similar reporting structure to other KPIs such as profit or margin. At Nextian we recommend building service reports following income statement structure: revenue, cost, gross profit/margin, sales cost (commissions) and net profit/margin.
Reporting Intervals
Since most services are billed monthly, operational reports are usually monthly or MTD (month-to-date). Other popular intervals include quarterly, yearly, and YTD (year-to-date).
Top Subscription Service KPIs and Metrics
| KPI | Description |
|---|---|
| Current Total MRR | Total MRR for all active (billed) services at the beginning of the reporting period. |
| Booked Orders | This is what the sales organization quoted and closed, i.e., received a PO signature from a customer or some other form of obligation that order has been placed. |
| Canceled Orders | Orders that were cancelled, before ordered services went into service, i.e., became operational. Order cancellations allowed in certain businesses (e.g., telecommunication services). |
| New Sales | New services for brand new customers (a.k.a. new logo sales). |
| Cross-Sales | Additional, new services purchased by existing customers, e.g.:
|
| Up-Sales / Uptick | Add-ons or upgrades to existing services resulting in revenue increase, e.g.:
|
| Down-Sales / Downtick | Downgrades or re-rates to existing services resulting in revenue decrease, e.g.:
|
| Canceled Services | Services that are fully cancelled by customers (in telecommunications space, these are often referred to as “disconnected” services). |
| New MRR | New Sales + Up-Sales + Cross-Sales |
| Lost MRR | Canceled Services + Downtick |
| Net MRR | New MRR – Lost MRR |
| Churn % | Lost Revenue / Current Total MRR |
| Compression / Contraction % | Down-Sales / Current Total MRR |
These are best visualized as waterfall charts:
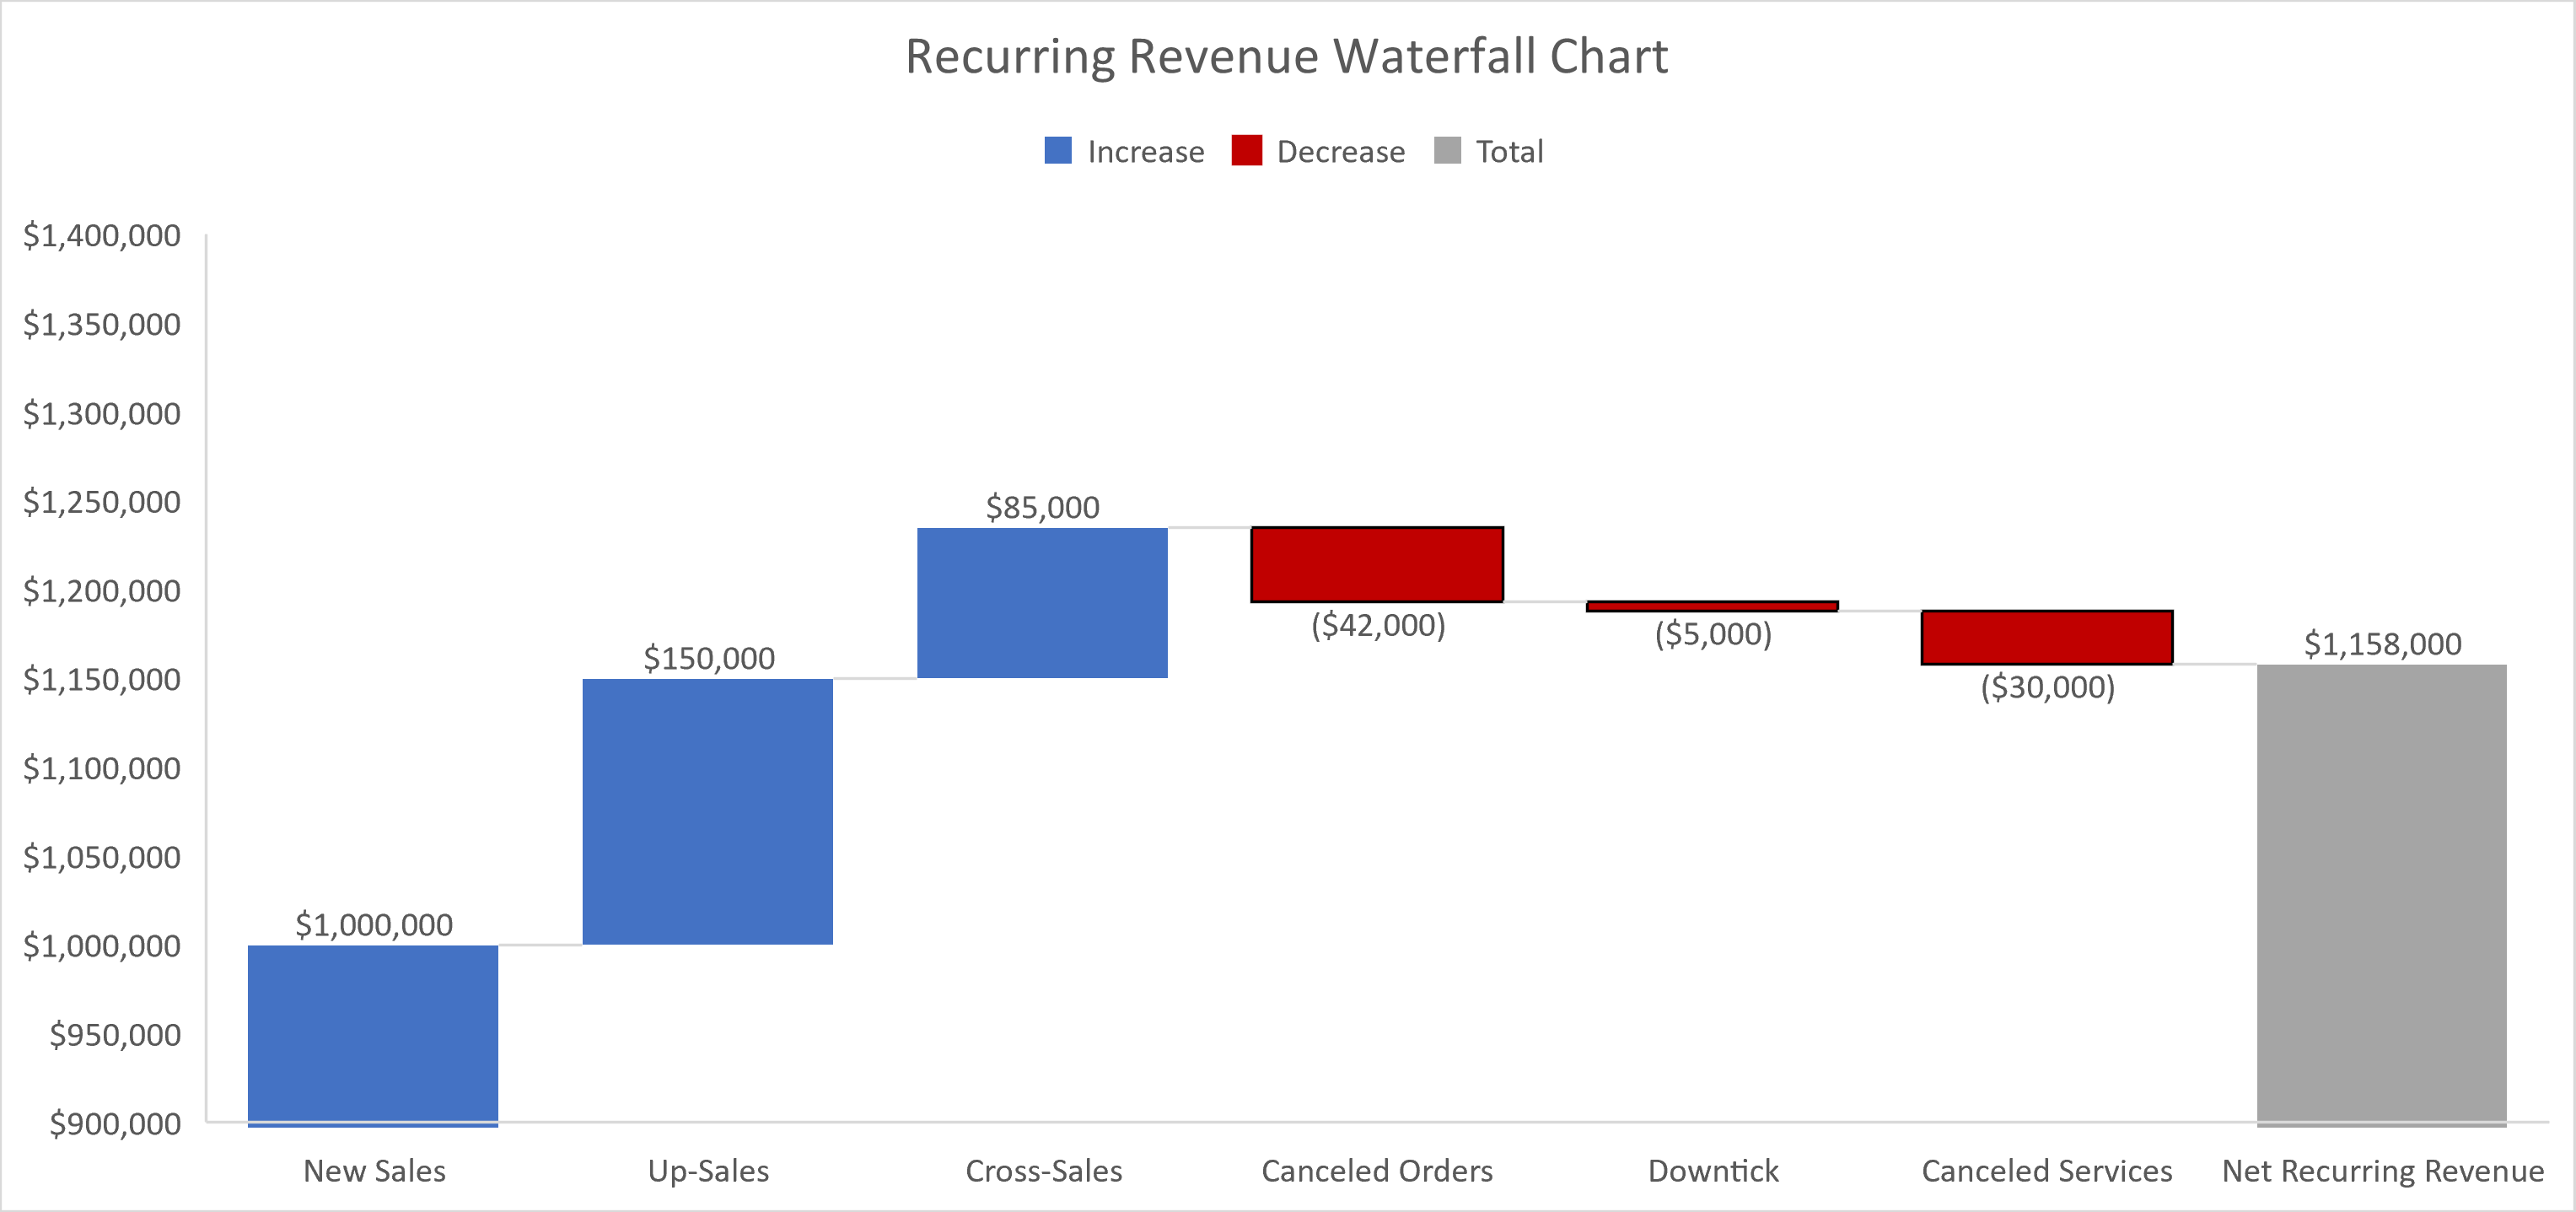
Example
First, we need to know the MRR at the beginning of the reporting period. To make calculations easy we will only use five services:
| SERVICE | MRR |
|---|---|
| SERVICE‑1 | $120.00 |
| SERVICE‑2 | $130.00 |
| SERVICE‑3 | $150.00 |
| SERVICE‑4 | $150.00 |
| SERVICE‑5 | $150.00 |
| Total Monthly MRR | $700.00 |
Let’s assume that the following orders have been received during the month (accounting notation used for negative numbers):
| Order # | Order Type | Service | Customer | Current MRR | New MRR | Net MRR |
|---|---|---|---|---|---|---|
| 1 | New | SERVICE‑6 | New | – | $150.00 | $150.00 |
| 2 | New | SERVICE‑7 | Existing | – | $180.00 | $180.00 |
| 3 | New | SERVICE‑8 | Existing | – | $170.00 | $170.00 |
| 4 | Order Canceled | SERVICE‑8 | Existing | $170.00 | – | ($170.00) |
| 5 | Cancel Service | SERVICE‑5 | Existing | – | ($150.00) | ($150.00) |
| 6 | Re-term (customer agreed to a longer term for a reduced monthly rate) | SERVICE‑4 | Existing | $150 | $140.00 | ($10.00) |
| 7 | Change (additional component added to the service) | SERVICE‑3 | Existing | $150 | $170.00 | $20.00 |
Depending on how order cancellations are handled [3] and [4] may be represented as a single, canceled order. At Nextian we recommend separating each transaction into an “order” (i.e., a separate request from the customer) and that is how we represented it in the example.
Service vs. Order Cancellation
This differentiation seems to cause a lot of confusion as these terms seem to be used almost interchangeably in certain businesses, however they mean two very distinct things:
- Order cancellation is a withdrawal of a previously issued order (no matter what that order is),
- Service cancellation causes termination of an existing service that is live (“in service”) at the time that service cancellation order has been issued by the customer.
The monthly metrics are as follows (order numbers from the table above are referenced with square brackets []):
| KPI | Value | Calculation |
|---|---|---|
| Booked Orders | $520.00 | [1] + [2] + [3] + [7] |
| Canceled Orders | ($170.00) | [4] |
| New Sales | $180.00 | [1] (the only order that is for new customer) |
| Cross-Sales | $150.00 | [2] (order [3] excluded because it had been canceled) |
| Up-Sales | $20.00 | [7] |
| Down-Sales | ($10.00) | [6] |
| Canceled Services | ($150.00) | [5] |
| New MRR | $370.00 | [1] + [2] + [7] |
| Lost MRR | ($160.00) | [5] + [6] |
| Net MRR | $190.00 | New MRR – Lost MRR (from two rows above) |
| Churn | 22.86% | $160.00 (Lost MRR) / $700.00 (revenue at the beginning of the reporting period) |
| Compression / Contraction | 1.43% | $10.00 (Down-Sales) / $700.00 (revenue at the beginning of the reporting period) |
Conclusions
The KPI calculations outlined here serve as a foundational starting point. Depending on the specific needs of a business, additional KPIs or alternative measurement methods may be required. These might include deeper analyses by product or service type, factoring in churn rates, pending service cancellations, or varied billing cycles.
At Nextian, we recommend the following best practices for building KPI reports and dashboards:
- Establish a strong data foundation: Ensure all essential data points are captured initially. With a solid foundation, creating even the most complex reports becomes straightforward.
- Start small and iterate: Begin with a minimum viable set of reports and refine them over time based on evolving needs.
- Prototype in Excel: Build examples in Microsoft Excel and review them with stakeholders. This process ensures consensus on naming conventions and formulas, simplifying the transition to reporting tools.
Nextian has extensive experience building KPI, reports and dashboards for cloud and communications providers, using Salesforce, Tableau and data warehouses.
Contact us today to find out how we can help you!