

The choice of reporting tools for Salesforce depends on many factors such as existing reporting tools, other business systems, cross system data correlation, etc.
This post is an attempt to lay out available options from the simplest to the most complex ones, as well as examine pros and cons of each.
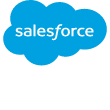
Salesforce standard list views, reports & dashboards
Salesforce offers robust reporting: users can create their own reports, charts, dashboards, etc. Many reports are available out-of-the-box, especially for CRM/sales.
Add-on applications usually provide their own reports. For example, Nextian provides about 80 standard reports and dashboards that can be further customized by the users.
| Good For | Self-service and entry level reporting. |
Snapshot reporting
Basic Salesforce reports and dashboards capture only the current state. To see historical charts & trends (e.g., how did my sales pipeline look like over the last 12 months?) additional tracking is required.
This can be achieved with Salesforce snapshot reporting. In essence, snapshot reports take existing reports and save results to a special object according to a user-defined schedule. For example, one can capture a snapshot of total sales pipeline every week and build a trend report.
Please note that Salesforce provides advanced date grouping functions in the standard reports, so snapshots are not required for reporting by months, quarters, fiscal quarters, etc.
| Good For | Intermediate level reporting with trending. |
Building own reporting objects
Sometimes snapshot reporting is insufficient. This usually happens when data is too complex to retrieve into a standard Salesforce report or requires a lot of transformation. It may also indicate that the current object model is lacking, or that a data warehouse may be a better solution.
As a workaround, a custom statistics object updated by a scheduled job can be used. This is very similar to built-in snapshot reporting, with much more flexibility.
| Good For | Relatively simple reports presenting data which is difficult to calculate/retrieve. |
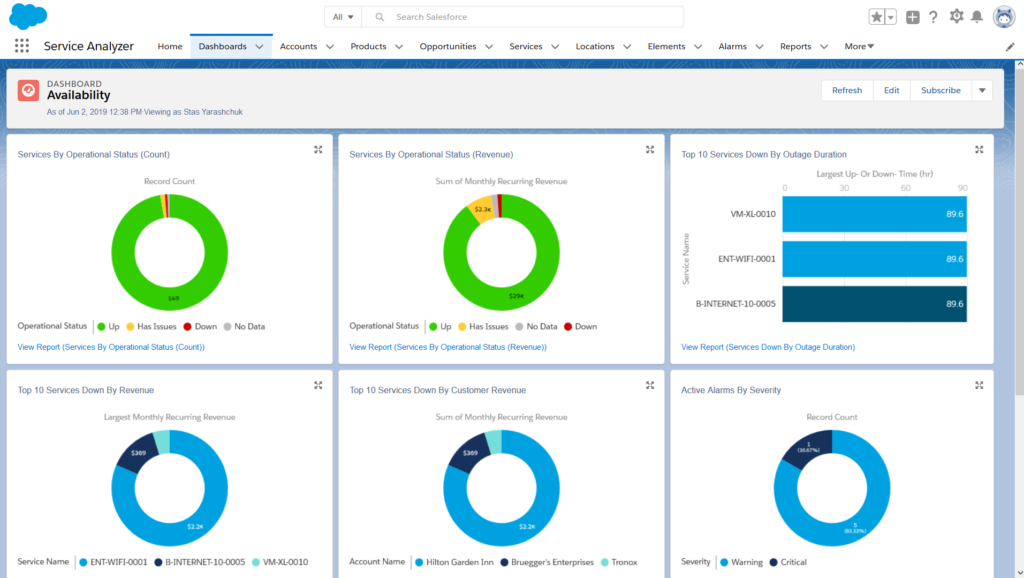
Using Microsoft Excel
Microsoft Excel provides built-in functionality to retrieve Salesforce object and report data into spreadsheets (Data → Get Data → From Online Services → From Salesforce Objects and Data → Get Data → From Online Services → From Salesforce Reports).
| Good For | Rudimentary and simple solution, especially useful for analyzing large sets of data without relationships to other objects. |
Using a Salesforce-aware reporting tool
Many modern reporting tools like Tableau or Power BI have Salesforce connectors. They enable building complex, good looking reports without requiring in-depth experience in data analytics. These typically create their own tables for fact and dimensions and are good for medium-sized data sets.
| Good For | Organizations that need advanced reports but are not using data warehousing yet. |
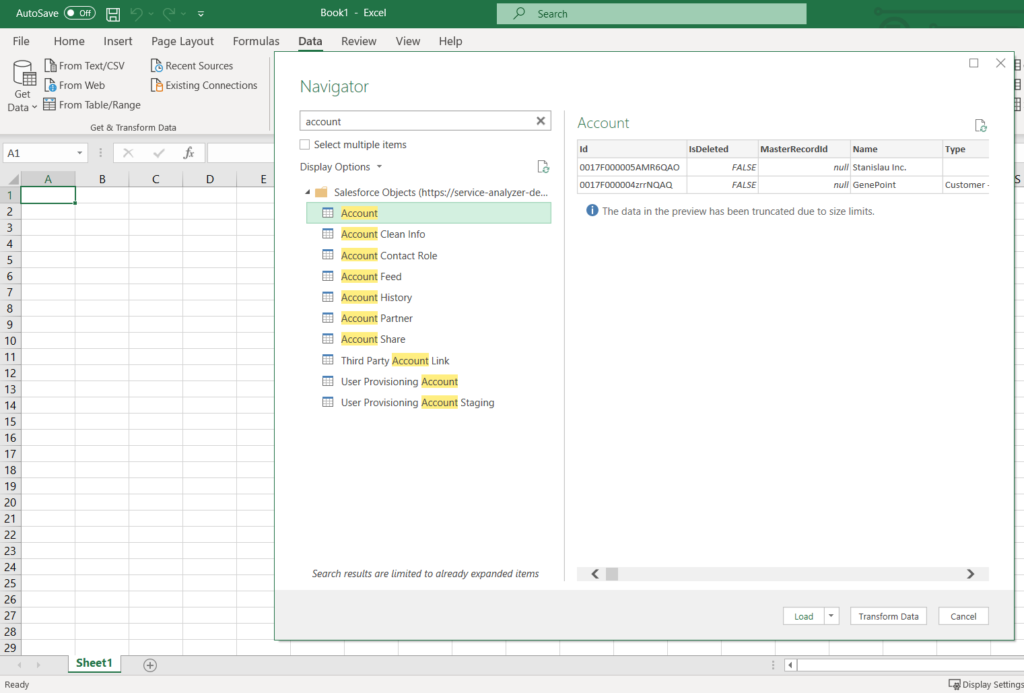
Pulling Salesforce data into a data warehouse
If a warehouse is already in place and fact calculations require Salesforce input data, it makes sense to leave operational reports within Salesforce, and move strategic/analytical reporting to the warehouse.
Since Salesforce does not provide access to its database (other than the API), a specialized connector or a third-party tool like Skyvia or Heroku ODBC connector must be used. More details on accessing Salesforce data are provided in this post.
ODBC connectors enable querying Salesforce with SQL which is easier than using the API or tools like Data Loader.
| Good For | Mature businesses already using a data warehouse and most likely having a data analytics team in place. |
Using Salesforce Analytics/Einstein
Salesforce offers an analytics platform called Salesforce Analytics/Einstein. It hasn’t been as long on the market as data warehouses and SQL databases; however, it is catching up quickly.
Salesforce Analytics can source data from systems other than Salesforce and there’s little it cannot do. Subscription costs and availability of consultants familiar with the platform need consideration before making the decision.
| Good For | Mature, large enterprises with majority of data residing in Salesforce. |
Conclusions
Choosing a reporting platform for Salesforce requires careful consideration, especially when requirements go beyond what can be achieved with basic built-in reports & dashboards.
Nextian is a vendor of Quote-to-Cash (QTC) software for cloud and communications helping providers accelerate growth and increase customer lifetime value.
Contact us today to find out how we can help you!

